

Most dance studios track vanity metrics that look good on paper but don't actually help with real decisions. You know your total enrollment, maybe your monthly revenue, definitely how many Instagram followers you have. But when it comes to the hard calls — should I hire another instructor? can I afford to expand? is it time to raise tuition? — most owners are basically guessing.
The problem isn't that studio owners don't understand business. Dance studio operations create this weird mix of artistic passion and financial reality that standard business metrics don't quite capture. You're not selling widgets. You're managing relationships, schedules, space constraints, and instructor availability while trying to hold onto quality and community feel all at once.
What shows up repeatedly across studios that actually scale is this: the successful ones tie specific financial metrics to specific operational decisions. Not vague goals like "increase profit" — concrete triggers. When this number hits X, we do Y.
The operational reality of dance studio metrics
Dance studios face a challenge that most business frameworks don't account for. Unlike retail or restaurants where transactions are discrete, studios deal with recurring relationships spread across multiple touchpoints. A single student might take three classes weekly, attend workshops, buy merchandise, and bring a sibling who takes something completely different. Traditional point-of-sale thinking misses this entirely.
What tends to happen instead is studios make reactive decisions. Enrollment dips, so you panic and offer discounts. Classes feel crowded, so you add more sections without checking whether the instructor costs actually make sense. Your best teacher asks for a raise and suddenly you're scrambling to figure out if you can swing it.
Studios that hold up well develop what I'd call decision triggers — specific metric thresholds that prompt specific actions. No guessing, no emotion, just clear operational responses grounded in real numbers.
Metric 1: Revenue per square foot per active hour
This sounds more complicated than it is. Honestly, it's one of the clearest indicators of whether you're using your space efficiently. Most studios only think about total square footage. What actually matters is how much money each foot generates during the hours you're actually running classes.
Eliminate scheduling headaches and missed payments.
Movioly streamlines booking, confirming, and managing every class with ease.
- Unified class and instructor scheduling
- Automated student notifications
- Integrated payment tracking
No credit card required
The calculation: Monthly revenue ÷ (Total square footage × Active hours per month) Active hours = hours when classes are scheduled, not total hours the building is open.
A 2,000 square foot studio doing $35,000 monthly with 140 active hours: $35,000 ÷ (2,000 × 140) = $0.125 per square foot per hour
Trigger actions based on this metric:
-
Below $0.10/sq ft/hour
- Review class schedule for dead zones - Consider subletting during off hours - Evaluate if some spaces could serve dual purposes
-
$0.10 - $0.15/sq ft/hour
- Operating efficiently but room to push further - Test adding specialty workshops in underused time slots - Consider pop-up events or rentals
-
Above $0.15/sq ft/hour
- Space is maxed out efficiently - Time to think seriously about expansion or a second location - Premium pricing is justifiable given demand
What this metric forces is a shift in how you think about your studio — from a monthly rent expense to a production asset. Studios commonly discover they have prime Saturday morning slots sitting at 8 students in a room that holds 20, while Tuesday evenings are cramming in 25. That imbalance shows up immediately once you run these numbers.
Metric 2: Student lifetime value vs. acquisition cost
Every studio owner knows roughly what they charge per month. Far fewer understand the true economics of getting and keeping a student. This metric pair tells you whether your growth strategy is actually working financially.
Student Lifetime Value (SLV) = Average monthly tuition × Average student lifespan in months Acquisition Cost = (Marketing spend + Trial class costs + Admin time) ÷ New students enrolled
Say average tuition is $140/month and students typically stay around 18 months: SLV = $140 × 18 = $2,520
If you spent $3,000 on marketing last month, offered 40 free trial classes valued at $20 each, and enrolled 15 new students: Acquisition Cost = ($3,000 + $800) ÷ 15 = $253 per student
Trigger actions:
When acquisition cost exceeds 15% of SLV:
-
Review marketing channels immediately for efficiency
-
Roll out referral incentives for existing students
-
Shift focus to retention over new acquisition
When SLV drops below $2,000:
-
Launch re-engagement campaigns for at-risk students
-
Review competitor pricing and your value proposition
-
Add complementary programs to increase monthly spend per student
When acquisition cost is under 10% of SLV:
-
Increase marketing investment
-
Test premium acquisition channels
-
Start evaluating additional locations
One studio found their Facebook ads were running $340 per enrollment. Their referral program — which cost a free month for the referring family — was bringing students in at $45 each. They shifted budget fast and enrollment climbed without touching total marketing spend.
Metric 3: Instructor efficiency ratio
This tells you whether you're staffing correctly and whether instructors are generating enough revenue to justify their cost. That framing sounds cold, but the point isn't to squeeze teachers — it's to understand the economics clearly enough to actually pay them fairly while keeping margins intact.
Instructor Efficiency = Revenue generated by instructor ÷ Total instructor cost Total cost includes wages, payroll taxes, and any benefits.
An instructor teaching 12 classes weekly at $65 per class with an average of 14 students: Monthly revenue = 12 classes × 4 weeks × 14 students × $16.25 per class = $9,750 Pay: $45/class plus 15% payroll burden: Monthly cost = 12 × 4 × $45 × 1.15 = $2,484 Efficiency ratio = $9,750 ÷ $2,484 = 3.92
Trigger actions:
-
Below 2.5 ratio
- Review scheduling and consolidation opportunities - Consider transitioning instructor to different class types - Evaluate whether smaller class formats justify premium pricing
-
2.5 - 4.0 ratio
- Healthy range, maintain current structure - Good window to invest in instructor development - Consider performance bonuses tied to retention
-
Above 4.0 ratio
- Instructor is highly profitable but potentially overextended - Add assistant instructors or consider splitting classes - Raise instructor compensation
The tricky part is balancing efficiency with quality. A teacher running a 5.0 ratio might look great on paper, but if classes are overcrowded or they're burning out, you'll pay for it in student losses down the road.
Metric 4: Capacity utilization by class type
Your hip-hop classes might run at 95% capacity while contemporary sits at 40%. Tracking this as a blended average across all classes is where studios go wrong — you need it broken out by type, level, and time slot.
Capacity Utilization = (Actual enrollment ÷ Maximum capacity) × 100
| Class Type | Time Slot | Capacity | Avg Enrollment | Utilization |
|---|---|---|---|---|
| Ballet 1 | Weekday Evening | 20 | 18 | 90% |
| Ballet 1 | Saturday Morning | 20 | 12 | 60% |
| Hip-Hop | Weekday Evening | 25 | 24 | 96% |
| Contemporary | Weekday Evening | 20 | 8 | 40% |
| Tots | Weekday Morning | 15 | 14 | 93% |
Trigger actions:
-
Above 85% utilization
- Add another section - Start a waitlist for full classes - Test premium pricing for high-demand slots
-
60-85% utilization
- Monitor for three months before changing anything - Test promotional pricing on specific sections - Survey students about schedule preferences
-
Below 60% utilization
- Combine with other underperforming sections - Change the time slot or instructor - After three months, consider discontinuing entirely
A studio in Michigan ran this analysis and realized their adult ballet classes averaged 45% capacity because they only offered weeknights. They added a Sunday morning section and hit 80% utilization within a month — same instructor cost, nearly double the revenue from that program.
Metric 5: Cash flow coverage period
This tells you how many days your studio could keep running if revenue stopped tomorrow. It determines whether you can absorb emergencies, invest in growth, or whether you should be worried about next month's rent.
Cash Coverage Period = (Cash on hand + Receivables) ÷ Daily operating expenses Daily operating expenses = (Monthly rent + Payroll + Insurance + Utilities + Other fixed costs) ÷ 30
If you have $18,000 in the bank, $4,000 in receivables, and $28,000 in monthly expenses: Daily expenses = $28,000 ÷ 30 = $933 Coverage period = $22,000 ÷ $933 = 24 days
Trigger actions:
-
Less than 30 days coverage
- Freeze all non-essential spending - Launch immediate retention campaigns - Negotiate payment terms with vendors - Put expansion plans on hold
-
30-60 days coverage
- Maintain current operations - Chase overdue accounts - Build reserves before making new investments
-
60-90 days coverage
- Safe to test new programs - Approve equipment purchases under $5,000 - Consider hiring if other metrics support it
-
Over 90 days coverage
- Prime position for expansion - Can absorb seasonal fluctuations without stress - Negotiate better vendor rates using upfront payment
Most studios sit under 20 days coverage, which is why a broken HVAC or a cluster of families leaving at once turns into a full crisis. Getting to 60+ days changes your entire decision-making posture.
Metric 6: Break-even per student
This one cuts through all the complexity. It tells you the absolute minimum number of students needed to keep the doors open — and more importantly, how much cushion you have above that number right now.
Break-even students = Total fixed monthly costs ÷ Average revenue per student Fixed costs include rent, insurance, base instructor pay, utilities, software, and admin. Average revenue spans tuition, registration fees, merchandise, recital tickets — spread across all students.
Fixed monthly costs: $24,000 Average revenue per student: $165 Break-even: $24,000 ÷ $165 = 145 students Current enrollment: 198 students Cushion: 53 students, or 27% above break-even
Trigger actions:
-
Within 10% of break-even
- Start emergency retention protocols - Cut all discretionary spending - Consider temporary price increases for new enrollments - Reduce offerings to your most profitable core programs
-
10-25% above break-even
- Focus on retention, not acquisition - Keep operations lean - Build cash reserves aggressively
-
25-40% above break-even
- Safe to bring on additional part-time staff - Test new programs with limited downside - Invest in facility improvements
-
Over 40% above break-even
- Consider full-time instructor positions - Expand into adjacent spaces - Start planning satellite locations
Every studio owner should know their break-even number without having to look it up. When enrollment drops to 160, you need to know instantly how much room you actually have.
Building your studio dashboard
Tracking these manually will eat your time and you'll eventually stop doing it. You need a dashboard that updates automatically and shows trigger points clearly.
Weekly Dashboard Review:
-
Current enrollment vs. break-even
-
Capacity utilization by class type
-
Cash position and coverage days
-
New enrollments vs. drops
Monthly Deep Dive:
-
Revenue per square foot per hour
-
Instructor efficiency ratios
-
Student lifetime value trends
-
Full P&L with variance analysis
Quarterly Strategic Review:
-
All metrics with historical trends
-
Competitor analysis and pricing check
-
Facility and expansion planning
-
Instructor development and compensation review
The dashboard doesn't need to be sophisticated. A spreadsheet that pulls from your class management software is fine. What matters is consistency — checking the same metrics the same way every week, without skipping it when things feel fine.
Set one person responsible for the weekly export and a recurring calendar reminder so the review actually happens.
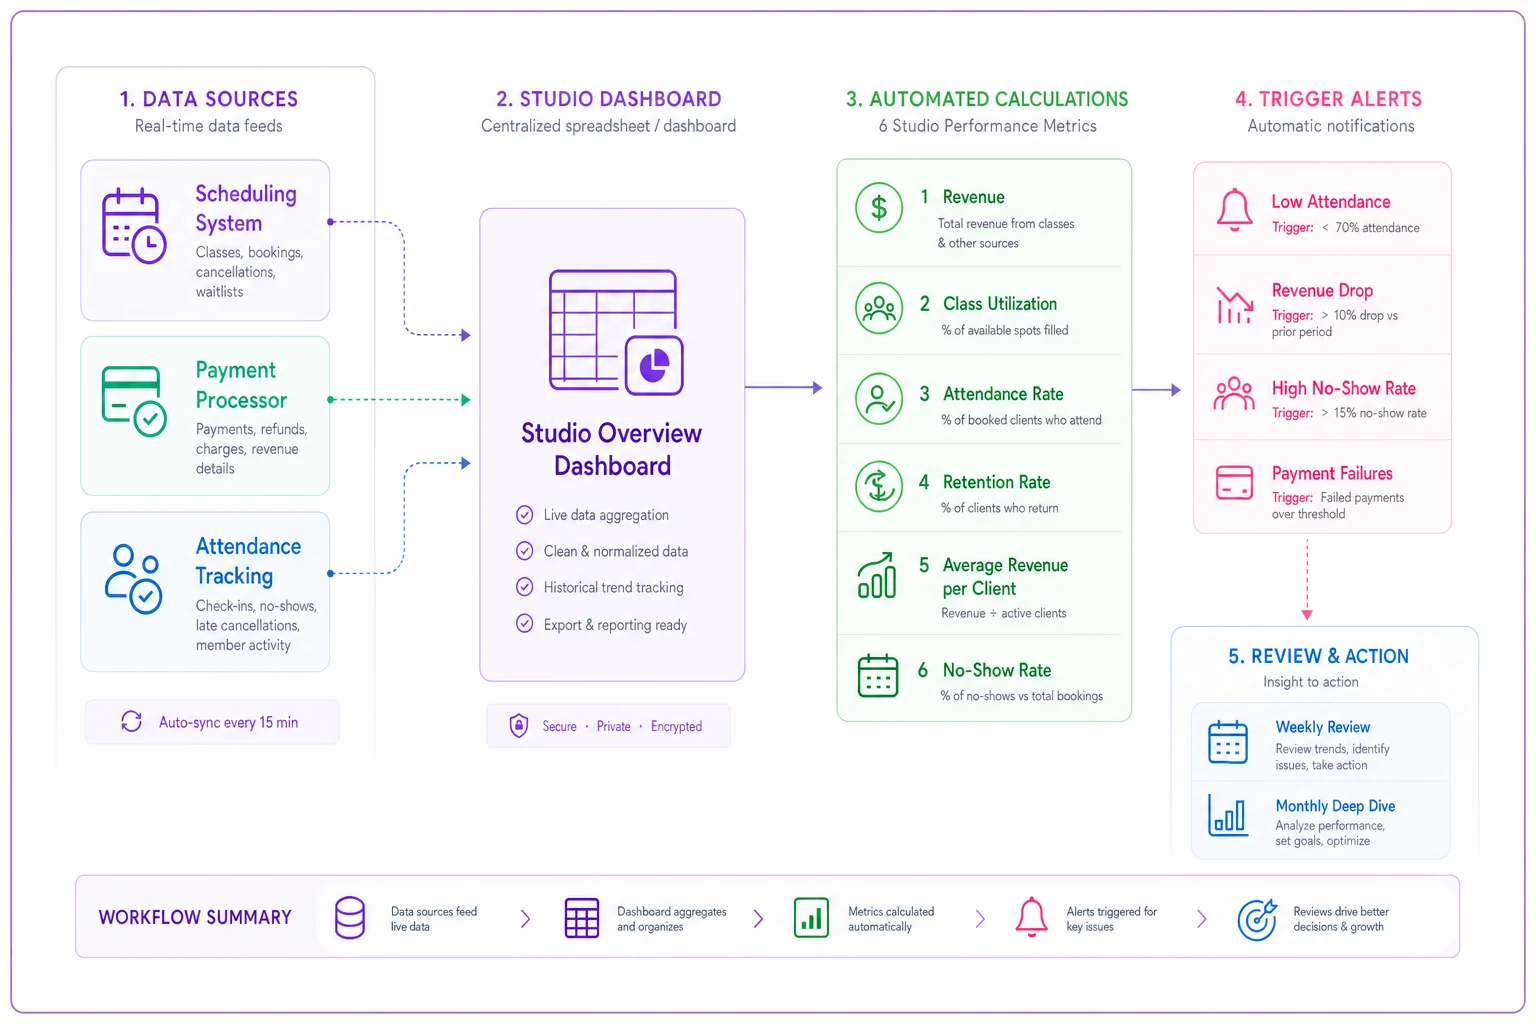
A quick visual of the data flow helps teams understand what to automate first and where manual checks still matter.
When metrics trigger action: real scenario
A jazz and contemporary studio was stuck at that uncomfortable "grow or die" point around 150 students. They ran through this metric system and here's what they found:
-
Revenue per square foot
$0.08/hour (below efficient)
-
Student lifetime value
$2,100
-
Acquisition cost
$380 (18% of SLV — too high)
-
Instructor efficiency average
2.2 (barely breaking even)
-
Capacity utilization
65% average, but 90% in evening contemporary
-
Cash coverage
18 days
-
Break-even
142 students
-
Current enrollment
151 students (6% cushion — genuinely dangerous)
The picture was clear: one bad month from crisis, spending too much to acquire students who weren't staying long enough, and running inefficient classes during their best time slots.
What they did:
-
Froze marketing spend and shifted to referral-only growth
-
Consolidated three underperforming afternoon classes
-
Added a second evening contemporary section — their highest-efficiency class
-
Negotiated payment terms with their landlord to improve cash position
-
Raised prices 8% on new enrollments only
Six months out:
-
Revenue per square foot
$0.13/hour
-
Student lifetime value
$2,450
-
Acquisition cost
$95
-
Cash coverage
52 days
-
Enrollment
168 students with 18% cushion
They didn't become a mega-studio. But they went from stressing about rent every month to planning their next expansion from a stable foundation.
The technology piece
Running these calculations manually becomes its own job eventually. This is where operational software with built-in automation earns its keep. A solid platform pulls data from your scheduling system, payment processor, and attendance tracking to calculate these metrics automatically — and more importantly, flags when you're approaching a trigger point before it becomes urgent.
Studios running AI-powered operational software get an extra layer here: the platform can surface patterns that are genuinely hard to catch manually. Which instructor substitutions tend to precede student drops. How school calendar cycles affect specific age groups. That kind of pattern recognition doesn't replace your judgment, it just makes it better informed.
The goal isn't automating decisions. It's spending less time on calculations and more time acting on what the numbers are actually telling you.
Common pitfalls
Over-optimizing for efficiency. One studio pushed instructor efficiency ratios so aggressively they lost three well-liked teachers inside two months. The remaining instructors hit solid ratios teaching overcrowded, mechanical classes. Enrollment fell hard within a semester.
Ignoring seasonal patterns. Dance studios have predictable cycles — summer drops, September surge, December chaos. Your triggers need seasonal adjustment, or you'll make panic decisions during completely normal fluctuations.
Fixating on a single metric. A studio that obsessed over capacity utilization kept combining classes until ballet sections hit 30 students. Utilization looked great. Quality tanked. Families left for competitors.
Analysis paralysis. Some owners track 40-plus metrics and never actually make a decision. Start with these six, get comfortable with them, then expand if needed.
Making it stick
The hard part isn't understanding the metrics. It's building the discipline to check them consistently and then actually follow what they're telling you — even when it cuts against your instincts. When enrollment dips, your gut says discount everything. But if you're still 20% above break-even with 60 days of cash coverage, the numbers say hold steady and focus on retention.
Start small. Pick three metrics from this list. Build a basic tracking system. Check them every Monday before you do anything else. Set your triggers and follow them even when it's uncomfortable.
The studios that survive long-term aren't always the ones with the best teachers or the nicest facilities. They're the ones that know their numbers well enough to make decisions quickly and confidently. In an industry where most people are operating on feel and hope, that becomes a real advantage.
Every studio eventually learns these lessons — usually through some painful, avoidable experience. The smarter move is building these systems before the crisis, when there's still room to maneuver. Your studio is already generating the data. These six metrics and their trigger points turn that data into something you can actually use.
Ready to elevate your studio operations?
Join 500+ studios using Movioly to save time, reduce admin workload, and enhance student experiences.