



Most studio dashboards lie. Not on purpose — nobody sits down to fake their retention number. But the dashboard shows 87% retention while the owner feels like more families are leaving than that, and both are kind of right. The dashboard is pulling from a definition of "active student" that quietly includes people who paused three months ago. The gut feeling is counting the families who stopped showing up but haven't formally cancelled. Two truths, one source, zero alignment.
That gap — between what your numbers say and what's actually happening in the building — is a governance problem. Not a reporting problem, not a software problem. The data underneath isn't defined, owned, or checked, so every report built on top of it inherits the mess.
This is the unglamorous layer nobody wants to touch. But if you're making hiring, pricing, or class-opening decisions based on dashboards, the quality of those decisions is capped by the quality of the data feeding them. So let's build the foundation properly.
The three systems that never agree
Almost every reconciliation headache in a studio traces back to the same three systems disagreeing: scheduling, billing, and attendance. They each hold a version of the truth, and they drift apart because they're updated by different people, at different times, for different reasons.
The pattern goes like this. Scheduling says a student is enrolled in Tuesday Ballet. Billing charges them monthly for that class. Attendance records who actually walked through the door. In a perfectly coordinated world, all three line up. In real operations, they never quite do:
-
A student switches from Tuesday to Thursday. Front desk updates the schedule but forgets the billing tag.
-
A family goes on a two-week vacation. Attendance shows absences, billing keeps charging, and now your "attendance rate" looks terrible for a paying, loyal family.
-
A trial student gets added to the roster for scheduling purposes but was never meant to be billed — and now your enrollment count is inflated.
Each of these is tiny. Individually, none of them matters much. But when you're reporting revenue-per-student, utilization, or churn, these small disagreements stack up into numbers you can't defend. Once you can't defend one number, the whole dashboard loses credibility — people stop trusting all of it, even the parts that are accurate.
Start with a minimal canonical data model
The fix starts with deciding, once, what your core objects are. Not twelve tables. A handful of clearly defined entities that everything else references. This is your canonical model — the single agreed-upon definition of what a student, a class, an enrollment, and a payment actually mean.
Eliminate scheduling headaches and missed payments.
Movioly streamlines booking, confirming, and managing every class with ease.
- Unified class and instructor scheduling
- Automated student notifications
- Integrated payment tracking
No credit card required
The mistake studios make is letting each system define these independently. Your billing tool has a "customer." Your scheduling tool has a "student." Your attendance app has a "participant." Nobody mapped them together, so the same kid exists three times with three IDs and no connection between them.
| Entity | What it represents | Key fields | Owner |
|---|---|---|---|
| Family | The billing/household unit | familyid, primarycontact, status | Front desk lead |
| Student | Individual dancer | studentid, familyid, DOB, status | Front desk lead |
| Class | A scheduled offering | classid, level, instructorid, capacity, term | Program director |
| Enrollment | Student↔Class link over time | enrollmentid, studentid, classid, startdate, end_date, status | Front desk lead |
| Payment | A billing event | paymentid, familyid, amount, date, enrollment_ref | Bookkeeper |
| Attendance | A single check-in | attendanceid, enrollmentid, class_date, status | Instructor |
The important part isn't the table itself. It's that enrollment is the connective tissue. Enrollment links a student to a class over a time window, and both payments and attendance should reference enrollment — not float around independently. When attendance ties to enrollment and enrollment ties to billing, your three disagreeing systems finally share a spine.
Notice the status field repeating across every entity. Each one needs a defined set of statuses with exact meanings. "Active," "paused," "trial," "withdrawn" — write down what each one means and when it changes. Most studio data chaos is actually status chaos: six people interpreting "active" six different ways.
KPI lineage: know where every number comes from
A decision-grade KPI is one you can trace all the way back to raw events. If someone asks "why is retention 83%?" you should be able to answer: this is the count of students with active enrollments at month-end who also had active enrollments last month, divided by last month's active count, excluding trials, measured on the 1st.
That full sentence is the lineage. If you can't write it out, the KPI isn't ready to drive decisions.
Here's what lineage looks like for a few core studio metrics:
-
Active students → count of
studentrecords where status = active AND at least one enrollment with end_date = null. Measured monthly on the 1st. -
Monthly recurring revenue → sum of recurring
paymentamounts for the billing period, excluding one-time fees, drop-ins, and merchandise. -
Class utilization → distinct active enrollments per class ÷ class capacity, averaged across the term.
-
True attendance rate → attended
attendancerecords ÷ expected sessions, where expected excludes approved pauses and holidays.
That last exclusion matters more than it looks. The difference between "attendance rate" and "attendance rate excluding approved absences" can be 10–15 points. If half your reports use one definition and half use the other, you'll spend meetings arguing about which number is "right" when both are technically correct — they just measure different things.
Write the lineage down next to each KPI on the dashboard. A tooltip or a footnote works fine. The discipline of documenting it forces you to notice when two metrics quietly use conflicting definitions. This is the same rigor that makes the financial metrics that signal when to hire or raise prices actually trustworthy — a decision threshold is only as good as the number it's being compared against.
SLIs and alert thresholds for data health
Software engineers monitor their systems with service-level indicators — small, measurable signals that tell you when something's broken before anyone notices. You can borrow the same idea for studio data without any of the jargon.
A data SLI is just a measurable check on whether your data is healthy. The goal is to catch drift automatically instead of discovering it when a report looks off.
-
Orphaned payments — payments with no linked enrollment. More than 3 in a week is worth a flag.
-
Enrollments with no attendance — a student enrolled 3+ weeks ago with zero check-ins. Likely a ghost enrollment or a reporting gap.
-
Billing-schedule mismatch — students being charged for a class they're not scheduled in, or vice versa. Anything above zero is worth a look; above 5 is urgent.
-
Status staleness — students marked "trial" for more than 30 days. Trials that never converted or got reclassified pollute your enrollment counts.
-
Duplicate families — same contact email or phone across two family records.
Set soft and hard thresholds. A soft threshold ("5 mismatches") goes in a weekly review. A hard threshold ("20 orphaned payments") gets attention the same day, because at that point your revenue reporting is actively wrong.
What most owners miss: these alerts aren't about catching staff mistakes. They're about catching process gaps — the handoffs where nobody owns the update. When orphaned payments spike, it almost always means a specific workflow (usually mid-term transfers) has no clear step for relinking billing.
A quick visual of the QA flow.
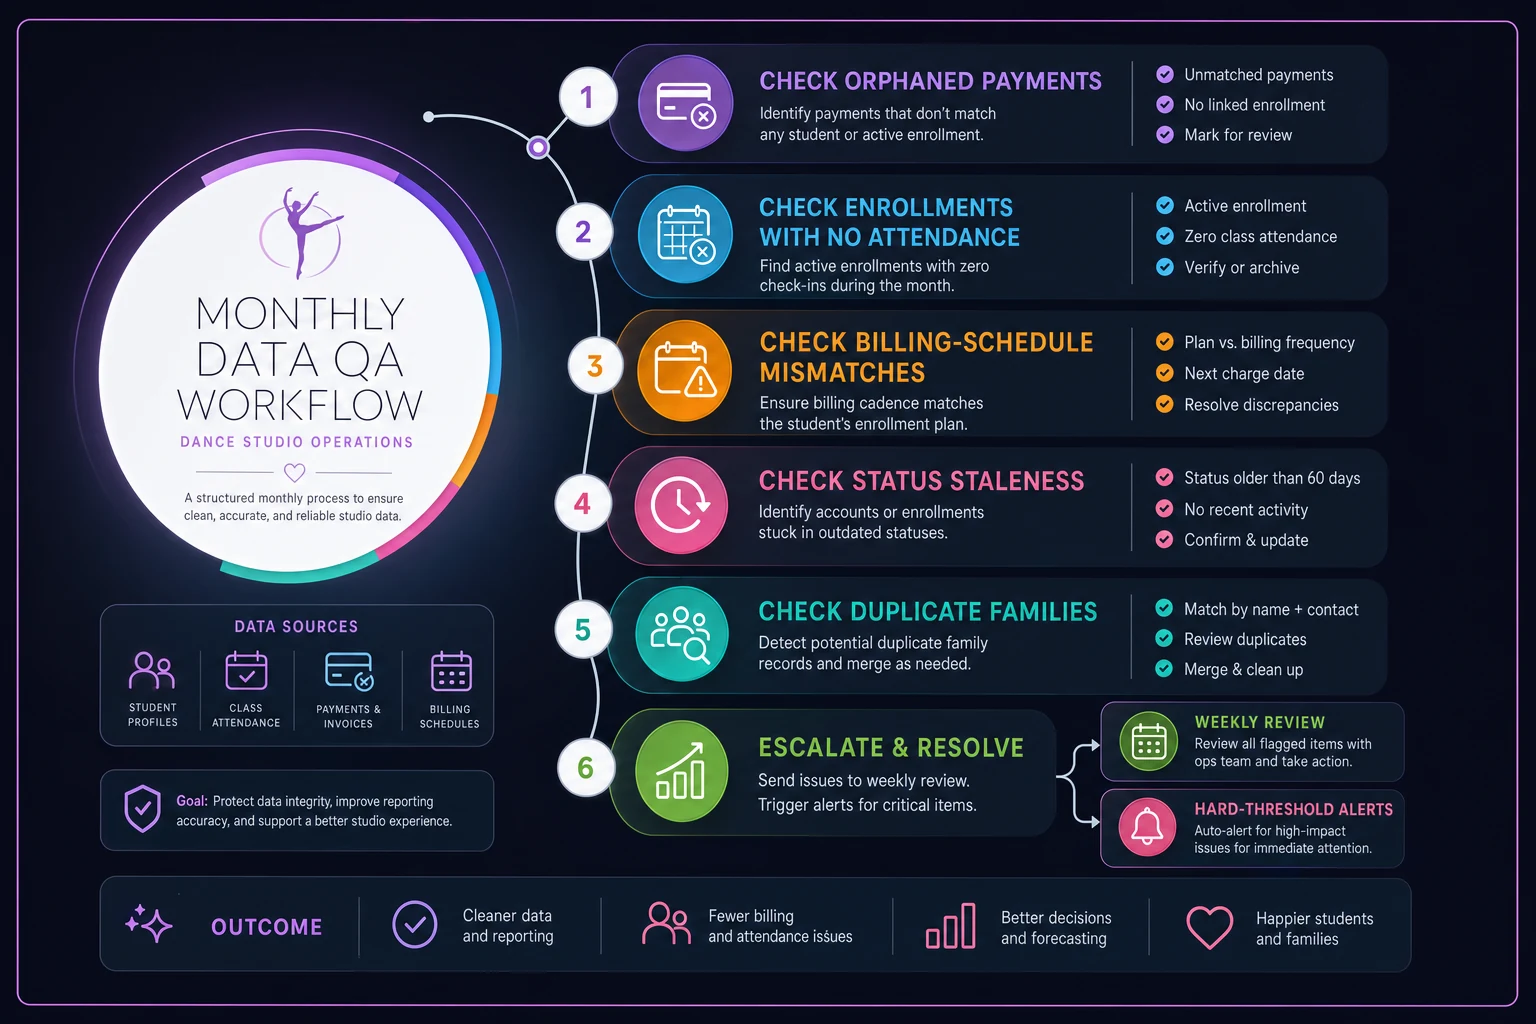
Use these SLIs to catch drift early and assign remediation steps so issues don't linger until reporting day.
The monthly QA routine a non-engineer can run
None of this requires a data analyst. The whole point of governance is making the checks simple enough that a front-desk lead or the owner can run them in under an hour each month. If it needs a technical person, it won't happen consistently — and inconsistent QA is almost worse than none, because it creates false confidence.
-
Pull active student count from the dashboard and from the raw enrollment list. Do they match within roughly 2%?
-
Spot-check 10 random students
is their billing status consistent with their enrollment status?
-
Review the orphaned-payments list. Relink or escalate each one.
-
Review trials older than 30 days. Convert, extend, or close each.
-
Reconcile total recurring revenue against the billing system's monthly total. Investigate any gap over ~$150.
-
Check for duplicate families by sorting on email and phone.
-
Confirm every class with enrollments has at least one attendance record logged in the last week.
-
Note any metric that changed more than 10% month-over-month and confirm there's a real-world reason.
That last item is quietly the most valuable one on the list. A metric that jumps 10% either reflects something real happening in your business — or a data problem. Either way, you want to know before you present it in a staff meeting.
Run this on the same day each month. Governance dies when it becomes "whenever we get around to it."
Run this on the same day each month. Governance dies when it becomes "whenever we get around to it."
A worked reconciliation example
Abstract rules click faster once you walk through a real one. Here's a reconciliation between scheduling, billing, and attendance for a mid-sized studio — roughly 280 active students across about 40 weekly classes.
The symptom: The owner's dashboard showed monthly recurring revenue of around $38,400. The bookkeeper's billing export showed closer to $41,100. Nearly a $2,700 gap, every month, with no obvious cause.
The reconciliation walk:
-
Started from the canonical enrollment list — 280 active enrollments.
-
Matched each enrollment to a recurring payment. 263 matched cleanly. 17 did not.
-
Of those 17
nine were students who'd switched classes mid-term. Billing kept the old, more expensive class rate; scheduling showed the new, cheaper one. The dashboard priced them off scheduling, billing charged off the old tag. That alone accounted for roughly $1,400 in "phantom" revenue the dashboard wasn't counting but billing was collecting.
-
Five were siblings on a family discount the dashboard logic didn't apply, so it undercounted their payments by the discount amount — roughly another $900.
-
Three were drop-in package students being counted as recurring in billing but not in the enrollment-driven dashboard — about $400.
Add it up and the $2,700 gap wasn't fraud or a broken system. It was three definition mismatches, each perfectly explainable once traced to its source.
The real number sat somewhere between the two — the billing total was slightly inflated by stale class tags, and the dashboard was understating because of discount logic. After fixing the enrollment references and the discount handling, the two systems landed within about $120 of each other, and that remaining gap had a documented reason. More importantly, the owner could finally quote a revenue number in a lender conversation without hedging.
This is what "decision-grade" actually means: not perfect to the penny, but explainable and reconciled, with every discrepancy accounted for.
An ownership matrix so nothing falls through
Data governance fails most often not because the rules are wrong but because nobody owns them. When everyone is responsible, no one is. The fix is a plain ownership matrix that says who owns each entity, who can change it, and who checks it.
| Data area | Owner (decides definition) | Editor (makes changes) | Reviewer (QA) |
|---|---|---|---|
| Student & family records | Front desk lead | Front desk staff | Owner (monthly) |
| Enrollments & transfers | Program director | Front desk lead | Front desk lead (weekly) |
| Billing & payments | Bookkeeper | Bookkeeper | Owner (monthly) |
| Attendance | Lead instructor | Instructors | Program director (weekly) |
| KPI definitions | Owner | Owner | — (reviewed quarterly) |
The non-obvious rule: the owner of a definition is not the same as the person who edits the data. Front desk staff edit student records constantly, but the definition of what "active" means should belong to one person so it doesn't drift. Separate the doing from the defining.
Keep this somewhere visible. A matrix buried in a shared drive doesn't change behavior. Studios that make governance stick tend to keep KPI definitions and ownership on one page everyone can find. Revisit those definitions quarterly — programs change, and a definition written for a term-based model breaks the moment you add year-round classes.
When this level of rigor makes sense — and when it doesn't
Not every studio needs all of this, and it's worth being honest about that.
When this makes sense: You're past roughly 150–200 students, you're running more than one software tool that holds overlapping data, or you're making real financial decisions — hiring, a second location, a loan — off your numbers. At that point the cost of a wrong decision far exceeds the cost of governance.
When it's overkill: You've got 40 students, one spreadsheet, and you personally know every family. Formal lineage documentation and SLI thresholds would just be bureaucracy for its own sake. Keep a clean spreadsheet and move on.
Who should NOT start here: If your data is currently in genuine chaos — multiple tools, no shared IDs, duplicates everywhere — don't start by writing SLI thresholds. Start by consolidating and cleaning. Governance maintains a clean system; it can't rescue a broken one. Clean first, then govern.
There's also a middle path worth naming. Some studios are tempted to automate every one of these checks the moment they learn about them. Resist that urge. Running the QA routine manually for a few months teaches you where your real failure points actually are. Once you know which three checks catch 90% of your problems, those are the ones worth automating — and the thinking behind what to automate and when, with ROI gates applies directly here. Automate the proven checks, not the hypothetical ones.
How this connects to everything else you measure
Clean, governed data isn't an end in itself — it's what makes every other analysis trustworthy. Cohort retention curves, utilization trends, revenue forecasts: all of them inherit the quality of the underlying model. When you run cohort analysis to trigger retention playbooks, the cohorts are only as meaningful as your enrollment and attendance data. Garbage in, confidently-presented garbage out.
That's the real payoff. Not the dashboard itself, but the ability to look at a number and act on it without second-guessing. When you can trust your retention figure, you can respond to a dip the same week instead of spending a staff meeting arguing about whether it's real. When you can trust utilization, you can open a class with confidence rather than a guess.
Good tooling helps — a platform that keeps students, enrollments, billing, and attendance tied to shared IDs eliminates whole categories of the mismatches described above, because the three systems were never separate to begin with. But the tool only works if the definitions and ownership behind it are clear. The software enforces the model; it doesn't invent it.
The quiet discipline that pays off
Studio data governance isn't a project you finish. It's a monthly habit — an hour of reconciliation, a glance at the SLI flags, a quarterly check of whether your definitions still match how you actually run the business. Unglamorous, easy to skip, and the single biggest difference between a studio that has dashboards and a studio that actually runs on them.
Start small. Pick your canonical entities, write the lineage for your five most important KPIs, assign ownership, and run the monthly QA once. The first time you catch a $2,000 revenue mismatch before it reaches a lender conversation — or avoid a hiring decision based on an inflated enrollment count — the hour a month will have paid for itself many times over.
Studio data governance isn't a project you finish. It's a monthly habit — an hour of reconciliation, a glance at the SLI flags, a quarterly check of whether your definitions still match how you actually run the business. Unglamorous, easy to skip, and the single biggest difference between a studio that has dashboards and a studio that actually runs on them.
Start small. Pick your canonical entities, write the lineage for your five most important KPIs, assign ownership, and run the monthly QA once. The first time you catch a $2,000 revenue mismatch before it reaches a lender conversation — or avoid a hiring decision based on an inflated enrollment count — the hour a month will have paid for itself many times over.
Ready to elevate your studio operations?
Join 500+ studios using Movioly to save time, reduce admin workload, and enhance student experiences.